US College Admissions Data
Acceptance Rates by School
| School
Schools are listed alphabetically.
|
2029 Acceptance Rate
The most recent data available. Acceptance rate for students entering in fall 2025
|
2028 Acceptance Rate
Acceptance rate for students entering in fall 2024.
|
2027 Acceptance Rate
Acceptance rate for students entering in fall 2023.
|
2026 Acceptance Rate
Acceptance rate for students entering in fall 2022.
|
2025 Acceptance Rate
Acceptance rate for students entering in fall 2021.
|
|---|---|---|---|---|---|
| American University | 54.0% | 55.0% | 44.0% | 40.6% | 64.1% |
| Amherst College | 7.4% | 9.0% | 9.0% | 7.3% | 8.7% |
| Babson College | NA | 17.1% | 19.7% | 22.4% | 25.4% |
| Barnard College | NA | 8.8% | 6.5% | 8.8% | 10.4% |
| Bates College | NA | 13.2% | 12.0% | 13.8% | 17.3% |
| Boston College | 12.6% | 15.9% | 15.0% | 16.7% | 18.9% |
| Boston University | 12.7% | 11.1% | 11.0% | 14.0% | 18.3% |
| Bowdoin College | 6.8% | 7.1% | 8.0% | 9.2% | 8.80% |
| Brown University | 5.7% | 5.4% | 5.1% | 5.0% | 5.50% |
| Bucknell University | 31.0% | 28.9% | 32.0% | 32.6% | 34.5% |
| Caltech | NA | 2.3% | TBA | 2.7% | 3.9% |
| Carleton College | 19.5% | 17.9% | 21.8% | 16.6% | 17.6% |
| Carnegie Mellon University | NA | NA | 11.0% | 11.3% | 13.5% |
| Case Western Reserve University | NA | 37.8% | 28.7% | 27.4% | 30.2% |
| Claremont McKenna College | NA | 9.6% | 11.1% | 10.4% | 11.2% |
| Colby College | 7.0% | 7.0% | 6.0% | 7.5% | 8.0% |
| Colgate University | 17.4% | 13.5% | 12.0% | 12.34% | 17.2% |
| College of the Holy Cross | 18.0% | 18.0% | 21.0% | 36.0% | 43.0% |
| Colorado College | 20.0% | 19.0% | 20% | 16.3% | 14.3% |
| Columbia University | 4.3% | 3.9% | 3.9% | 3.74% | 3.90% |
| Cornell University | NA | 8.4% | 7.3% | 7.3% | ~8.70% |
| Dartmouth College | 6.0% | 5.4% | 6.2% | 6.4% | 6.17% |
| Davidson College | NA | 13.4% | 14.5% | 17.0% | 17.8% |
| Denison University | 19.5% | 17.3% | 17.0% | 22.0% | 28.3% |
| Duke University | 4.8% | 5.4% | 6.0% | 6.20% | 5.7% |
| Elon University | NA | NA | 67.0% | 74.5% | 77.7% |
| Emory University | 15.0% | 10.3% | 10.0% | 15.8% | 20.4% |
| Fairfield University | 24.9% | 33.2% | 44.9% | 52.2% | 55.8% |
| Florida State University | 24.0% | 24.2% | 23.8% | 25.0% | 37.1% |
| Fordham University | 54.0% | 59.3% | 54.3% | 53.0% | 58.3% |
| Georgetown University | 12.2% | 12.3% | 13.0% | 12.10% | 12.00% |
| Georgia Tech | 12.7% | 14.1% | 16.0% | 17.1% | 18.3% |
| Grinnell College | NA | NA | 12.7% | 10.8% | 10.5% |
| Hamilton College | NA | 13.6% | 11.8% | 11.8% | 14.1% |
| Harvard University | NA | 3.7% | 3.4% | 3.19% | 3.43% |
| Harvey Mudd College | NA | 12.7% | 13.1% | 13.4% | 10.0% |
| Haverford College | 13.3% | 12.4% | 12.9% | 14.2% | 17.8% |
| Johns Hopkins University | NA | 6.4% | 6.3% | 7.24% | 7.4% |
| Lafayette College | 29.5% | 31.5% | 30.7% | 33.6% | 40.7% |
| Lehigh University | NA | 25.9% | 28.5% | 37.0% | 46.0% |
| Loyola University Maryland | NA | NA | 76.0% | 83.5% | 84.2% |
| Macalester College | 27.2% | 28.5% | 27.6% | 28.4% | 31.3% |
| Miami University, Ohio | NA | NA | 83.4% | 82.54% | 88.6% |
| Middlebury College | 14.0% | 12.0% | 11.0% | 12.7% | 15.70% |
| MIT | 4.5% | 4.6% | 4.8% | 3.96% | 4.0% |
| New York University | 7.7% | 8.0% | 8.0% | 12.46% | 12.8% |
| Northeastern University | NA | 5.2% | 6.0% | 6.8% | 18.4% |
| Northwestern University | 7.0% | 7.6% | 7.0% | 7.21% | 6.80% |
| Oberlin College | 34.0% | 34.3% | 32.9% | 34.9% | 34.3% |
| Pepperdine University | NA | NA | NA | 48.7% | 52.7% |
| Pitzer College | 26.8% | 25.2% | 16.7% | 18.4% | 18.3% |
| Pomona College | NA | 7.1% | 6.8% | 7.0% | 6.60% |
| Princeton University | NA | 4.6% | 4.5% | 5.7% | 3.98% |
| Rice University | 7.8% | 8.0% | 7.7% | 8.7% | 9.3% |
| Santa Clara University | NA | 48.0% | 42.0% | 52.1% | 54.0% |
| Smith College | NA | 21.0% | 19.0% | 22.9% | 29.9% |
| Stanford University | NA | 3.6% | 3.9% | 3.7% | 3.95% |
| Swarthmore College | 7.4% | 7.5% | 6.8% | 6.9% | 8.0% |
| Trinity University | 25.2% | 25.9% | 28.0% | 31.0% | 33.7% |
| Tufts University | 10.5% | 11.5% | 9.5% | 9.69% | 11.0% |
| Tulane University | NA | 14.0% | 13.0% | 11.5% | 9.6% |
| UCLA | 9.4% | 9.0% | 8.8% | 8.56% | 10.76% |
| UC – Berkeley | 11.4% | 11% | 11.6% | 11.4% | 14.5% |
| UC – Davis | 42.6% | 42.1% | 41.8% | 37.5% | 48.7% |
| UC – Irvine | 28.7% | 28.8% | 25.8% | 21.3% | 26.3% |
| UC – Merced | NA | NA | 93.3% | 89.5% | 86.6% |
| UC – Riverside | NA | NA | 68.1% | 68.5% | 65.4% |
| UC – San Diego | 28.4% | 26.8% | 24.7% | 23.7% | 34.2% |
| UC – Santa Barbara | 38.3% | 33.0% | 27.9% | 25.9% | 29.2% |
| UC – Santa Cruz | NA | NA | 62.7% | 46.9% | 58.7% |
| University of Chicago | NA | 4.5% | 5.0% | 5.4% | 6.2% |
| University of Florida | NA | NA | 24.0% | 23.4% | 29.0% |
| University of Georgia | NA | 36.9% | 35.1% | 42.2% | 39.0% |
| University of Miami | NA | 18.9% | 19.0% | 18.9% | 28.5% |
| University of Michigan | NA | 15.6% | 17.9% | 17.7% | 20.2% |
| University of North Carolina | NA | NA | 18.4% | 16.9% | 19.2% |
| University of Notre Dame | 9.0% | 11.1% | 11.9% | 12.9% | 14.6% |
| University of Pennsylvania | 4.9% | NA | 5.8% | 6.5% | 5.7% |
| University of Richmond | 21.0% | 22.0% | 22.0% | 24.4% | 27.3% |
| University of Southern California | 10.4% | 9.8% | 9.9% | 11.9% | 12.0% |
| University of Texas – Austin | NA | 26.6% | 29.1% | 31.4% | 28.8% |
| University of Vermont | NA | NA | 60.0% | 59.8% | 63.5% |
| University of Virginia | 15.4% | 16.8% | 16.0% | 18.7% | 21.0% |
| Vanderbilt University | 4.6% | 5.8% | 5.6% | 6.1% | 6.7% |
| Vassar College | NA | 18.6% | 17.7% | 18.7% | 20.2% |
| Villanova University | 27.4% | 27.0% | 20.5% | 23.4% | 25.2% |
| Wake Forest University | NA | NA | 22.3% | 21.4% | 25.2% |
| Washington and Lee University | NA | NA | 17.4% | 17.0% | 18.9% |
| Washington University in St. Louis | NA | 14.0% | 12.0% | 11.3% | 13.0% |
| Wellesley College | 13.7% | 14.0% | 13.0% | 13.6% | 16.0% |
| Wesleyan University | 16.1% | 16.5% | 16.5% | 14.4% | 19.4% |
| William & Mary | 36.3% | 34.0% | 32.0% | 33.5% | 36.5% |
| Williams College | 8.5% | 7.5% | 9.8% | 8.5% | 8.0% |
| Yale University | 4.6% | 3.9% | 4.4% | 4.6% | 4.6% |
Walkthrough
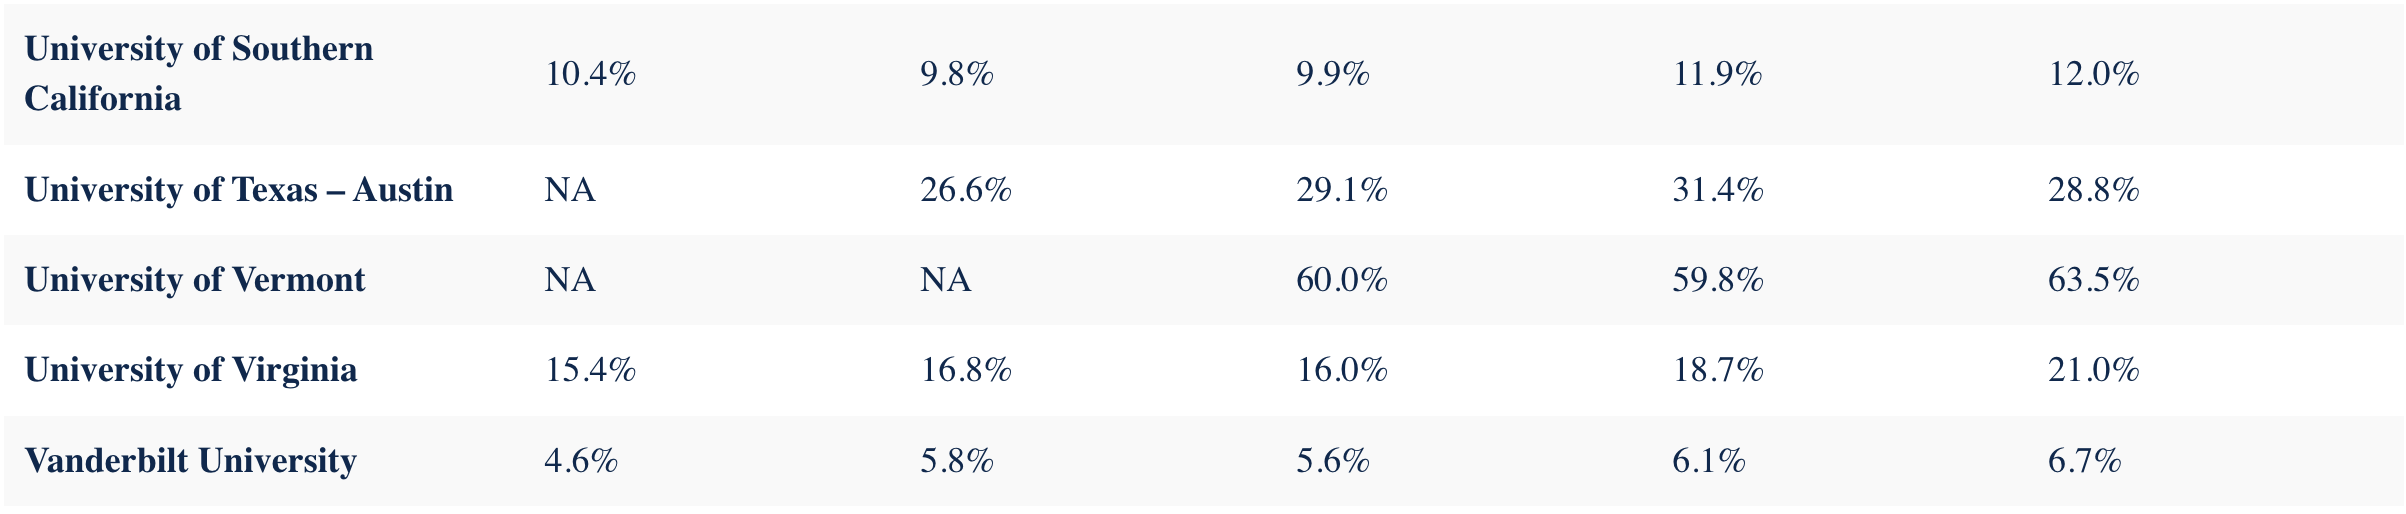
Example 1: USC's Improving Odds
USC's acceptance rate has been steadily growing over the last 5 years.
Click here to see USC's row in the table —
notice how the rate climbed from 9.9% in 2027 all the way to 10.4% in 2029.
While it marginally dipped between 2027 and 2028, the overall trend has been
an increase. This would indicate to prospective applicants that USC is becoming
slightly less competitive over time, and could be a strategic pick for applicants
on the fence about including it on their list.
Example 2: Vanderbilt's Consistent Selectivity
Vanderbilt is one of the most consistently selective schools in the dataset.
Click here to see Vanderbilt's row in the table —
its acceptance rate has hovered between 4.6% and 6.7% across all five years,
never crossing 7%. Unlike schools whose rates fluctuate widely year to year,
Vanderbilt's stability signals a highly controlled admissions process.
Applicants should treat it as a reach school regardless of the year they apply.