US College Admissions Data
Purpose of this Page
This webpage is designed to present US college admissions data of the last 5 years, covering the classes of 2025 to 2029. The purpose of this page is to give prospective college applicants an overview of how competitive admissions to various schools have been in recent years. By analyzing these trends, applicants can make more informed college application lists, decisions, and goals.
Acceptance Rates by School
| School | 2029 Acceptance Rate | 2028 Acceptance Rate | 2027 Acceptance Rate | 2026 Acceptance Rate | 2025 Acceptance Rate |
|---|---|---|---|---|---|
| American University | 54.0% | 55.0% | 44.0% | 40.6% | 64.1% |
| Amherst College | 7.4% | 9.0% | 9.0% | 7.3% | 8.7% |
| Babson College | NA | 17.1% | 19.7% | 22.4% | 25.4% |
| Barnard College | NA | 8.8% | 6.5% | 8.8% | 10.4% |
| Bates College | NA | 13.2% | 12.0% | 13.8% | 17.3% |
| Boston College | 12.6% | 15.9% | 15.0% | 16.7% | 18.9% |
| Boston University | 12.7% | 11.1% | 11.0% | 14.0% | 18.3% |
| Bowdoin College | 6.8% | 7.1% | 8.0% | 9.2% | 8.80% |
| Brown University | 5.7% | 5.4% | 5.1% | 5.0% | 5.50% |
| Bucknell University | 31.0% | 28.9% | 32.0% | 32.6% | 34.5% |
| Caltech | NA | 2.3% | TBA | 2.7% | 3.9% |
| Carleton College | 19.5% | 17.9% | 21.8% | 16.6% | 17.6% |
| Carnegie Mellon University | NA | NA | 11.0% | 11.3% | 13.5% |
| Case Western Reserve University | NA | 37.8% | 28.7% | 27.4% | 30.2% |
| Claremont McKenna College | NA | 9.6% | 11.1% | 10.4% | 11.2% |
| Colby College | 7.0% | 7.0% | 6.0% | 7.5% | 8.0% |
| Colgate University | 17.4% | 13.5% | 12.0% | 12.34% | 17.2% |
| College of the Holy Cross | 18.0% | 18.0% | 21.0% | 36.0% | 43.0% |
| Colorado College | 20.0% | 19.0% | 20% | 16.3% | 14.3% |
| Columbia University | 4.3% | 3.9% | 3.9% | 3.74% | 3.90% |
| Cornell University | NA | 8.4% | 7.3% | 7.3% | ~8.70% |
| Dartmouth College | 6.0% | 5.4% | 6.2% | 6.4% | 6.17% |
| Davidson College | NA | 13.4% | 14.5% | 17.0% | 17.8% |
| Denison University | 19.5% | 17.3% | 17.0% | 22.0% | 28.3% |
| Duke University | 4.8% | 5.4% | 6.0% | 6.20% | 5.7% |
| Elon University | NA | NA | 67.0% | 74.5% | 77.7% |
| Emory University | 15.0% | 10.3% | 10.0% | 15.8% | 20.4% |
| Fairfield University | 24.9% | 33.2% | 44.9% | 52.2% | 55.8% |
| Florida State University | 24.0% | 24.2% | 23.8% | 25.0% | 37.1% |
| Fordham University | 54.0% | 59.3% | 54.3% | 53.0% | 58.3% |
| Georgetown University | 12.2% | 12.3% | 13.0% | 12.10% | 12.00% |
| Georgia Tech | 12.7% | 14.1% | 16.0% | 17.1% | 18.3% |
| Grinnell College | NA | NA | 12.7% | 10.8% | 10.5% |
| Hamilton College | NA | 13.6% | 11.8% | 11.8% | 14.1% |
| Harvard University | NA | 3.7% | 3.4% | 3.19% | 3.43% |
| Harvey Mudd College | NA | 12.7% | 13.1% | 13.4% | 10.0% |
| Haverford College | 13.3% | 12.4% | 12.9% | 14.2% | 17.8% |
| Johns Hopkins University | NA | 6.4% | 6.3% | 7.24% | 7.4% |
| Lafayette College | 29.5% | 31.5% | 30.7% | 33.6% | 40.7% |
| Lehigh University | NA | 25.9% | 28.5% | 37.0% | 46.0% |
| Loyola University Maryland | NA | NA | 76.0% | 83.5% | 84.2% |
| Macalester College | 27.2% | 28.5% | 27.6% | 28.4% | 31.3% |
| Miami University, Ohio | NA | NA | 83.4% | 82.54% | 88.6% |
| Middlebury College | 14.0% | 12.0% | 11.0% | 12.7% | 15.70% |
| MIT | 4.5% | 4.6% | 4.8% | 3.96% | 4.0% |
| New York University | 7.7% | 8.0% | 8.0% | 12.46% | 12.8% |
| Northeastern University | NA | 5.2% | 6.0% | 6.8% | 18.4% |
| Northwestern University | 7.0% | 7.6% | 7.0% | 7.21% | 6.80% |
| Oberlin College | 34.0% | 34.3% | 32.9% | 34.9% | 34.3% |
| Pepperdine University | NA | NA | NA | 48.7% | 52.7% |
| Pitzer College | 26.8% | 25.2% | 16.7% | 18.4% | 18.3% |
| Pomona College | NA | 7.1% | 6.8% | 7.0% | 6.60% |
| Princeton University | NA | 4.6% | 4.5% | 5.7% | 3.98% |
| Rice University | 7.8% | 8.0% | 7.7% | 8.7% | 9.3% |
| Santa Clara University | NA | 48.0% | 42.0% | 52.1% | 54.0% |
| Smith College | NA | 21.0% | 19.0% | 22.9% | 29.9% |
| Stanford University | NA | 3.6% | 3.9% | 3.7% | 3.95% |
| Swarthmore College | 7.4% | 7.5% | 6.8% | 6.9% | 8.0% |
| Trinity University | 25.2% | 25.9% | 28.0% | 31.0% | 33.7% |
| Tufts University | 10.5% | 11.5% | 9.5% | 9.69% | 11.0% |
| Tulane University | NA | 14.0% | 13.0% | 11.5% | 9.6% |
| UCLA | 9.4% | 9.0% | 8.8% | 8.56% | 10.76% |
| UC – Berkeley | 11.4% | 11% | 11.6% | 11.4% | 14.5% |
| UC – Davis | 42.6% | 42.1% | 41.8% | 37.5% | 48.7% |
| UC – Irvine | 28.7% | 28.8% | 25.8% | 21.3% | 26.3% |
| UC – Merced | NA | NA | 93.3% | 89.5% | 86.6% |
| UC – Riverside | NA | NA | 68.1% | 68.5% | 65.4% |
| UC – San Diego | 28.4% | 26.8% | 24.7% | 23.7% | 34.2% |
| UC – Santa Barbara | 38.3% | 33.0% | 27.9% | 25.9% | 29.2% |
| UC – Santa Cruz | NA | NA | 62.7% | 46.9% | 58.7% |
| University of Chicago | NA | 4.5% | 5.0% | 5.4% | 6.2% |
| University of Florida | NA | NA | 24.0% | 23.4% | 29.0% |
| University of Georgia | NA | 36.9% | 35.1% | 42.2% | 39.0% |
| University of Miami | NA | 18.9% | 19.0% | 18.9% | 28.5% |
| University of Michigan | NA | 15.6% | 17.9% | 17.7% | 20.2% |
| University of North Carolina | NA | NA | 18.4% | 16.9% | 19.2% |
| University of Notre Dame | 9.0% | 11.1% | 11.9% | 12.9% | 14.6% |
| University of Pennsylvania | 4.9% | NA | 5.8% | 6.5% | 5.7% |
| University of Richmond | 21.0% | 22.0% | 22.0% | 24.4% | 27.3% |
| University of Southern California | 10.4% | 9.8% | 9.9% | 11.9% | 12.0% |
| University of Texas – Austin | NA | 26.6% | 29.1% | 31.4% | 28.8% |
| University of Vermont | NA | NA | 60.0% | 59.8% | 63.5% |
| University of Virginia | 15.4% | 16.8% | 16.0% | 18.7% | 21.0% |
| Vanderbilt University | 4.6% | 5.8% | 5.6% | 6.1% | 6.7% |
| Vassar College | NA | 18.6% | 17.7% | 18.7% | 20.2% |
| Villanova University | 27.4% | 27.0% | 20.5% | 23.4% | 25.2% |
| Wake Forest University | NA | NA | 22.3% | 21.4% | 25.2% |
| Washington and Lee University | NA | NA | 17.4% | 17.0% | 18.9% |
| Washington University in St. Louis | NA | 14.0% | 12.0% | 11.3% | 13.0% |
| Wellesley College | 13.7% | 14.0% | 13.0% | 13.6% | 16.0% |
| Wesleyan University | 16.1% | 16.5% | 16.5% | 14.4% | 19.4% |
| William & Mary | 36.3% | 34.0% | 32.0% | 33.5% | 36.5% |
| Williams College | 8.5% | 7.5% | 9.8% | 8.5% | 8.0% |
| Yale University | 4.6% | 3.9% | 4.4% | 4.6% | 4.6% |
Chart Analysis
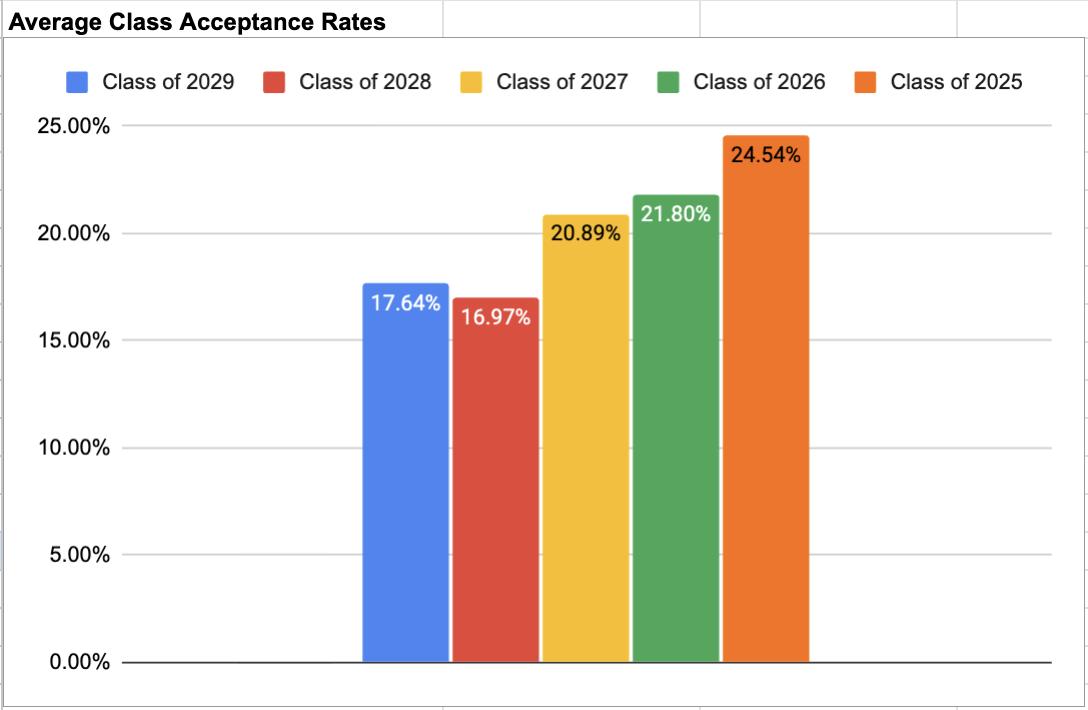
Chart 1: Average acceptance rates across all schools by graduating class (2025–2029)
The overall average acceptance rate across all tracked schools has declined steadily from the Class of 2025 to the Class of 2029, dropping from 24.54% down to about 17.64%. This downward trend reflects a broader national pattern, as more students apply to college each year, schools admit a smaller share of their applicant pools. For prospective applicants, this chart is a clear signal that the competitive landscape is tightening across the board, not just at elite institutions.
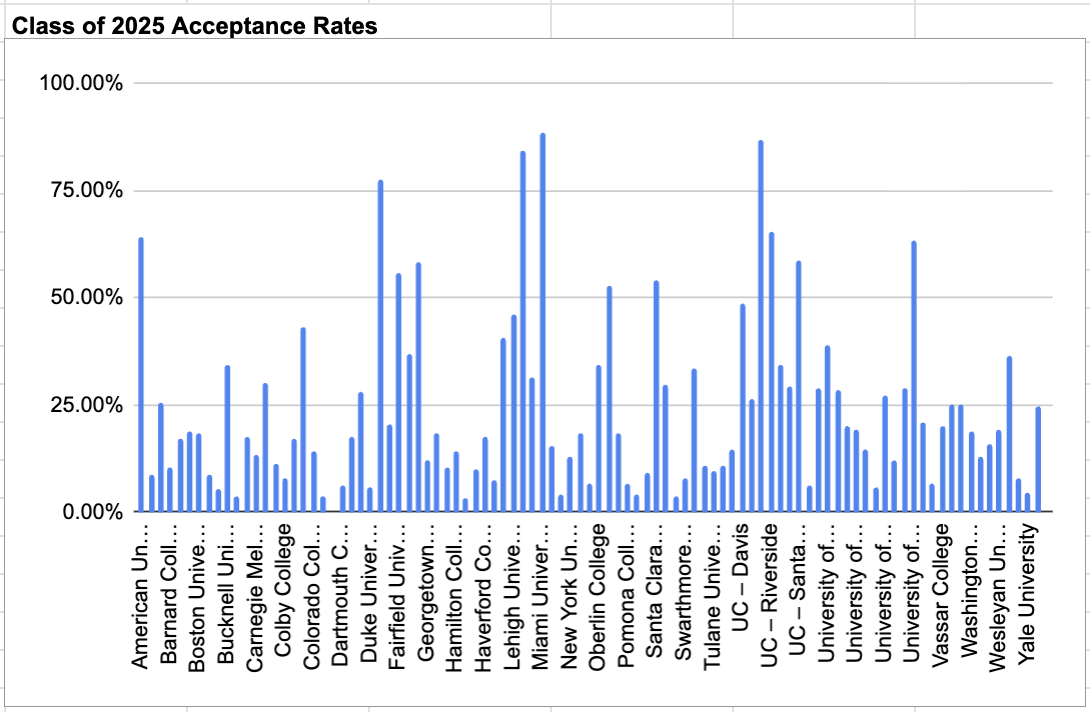
Chart 2: Individual school acceptance rates for the Class of 2025
This chart breaks down acceptance rates school-by-school for the Class of 2025, showing the wide range in selectivity within an admissions cycle. This spread is a useful reminder that "college admissions" are diverse, and applicants face dramatically different odds depending on which schools they target.
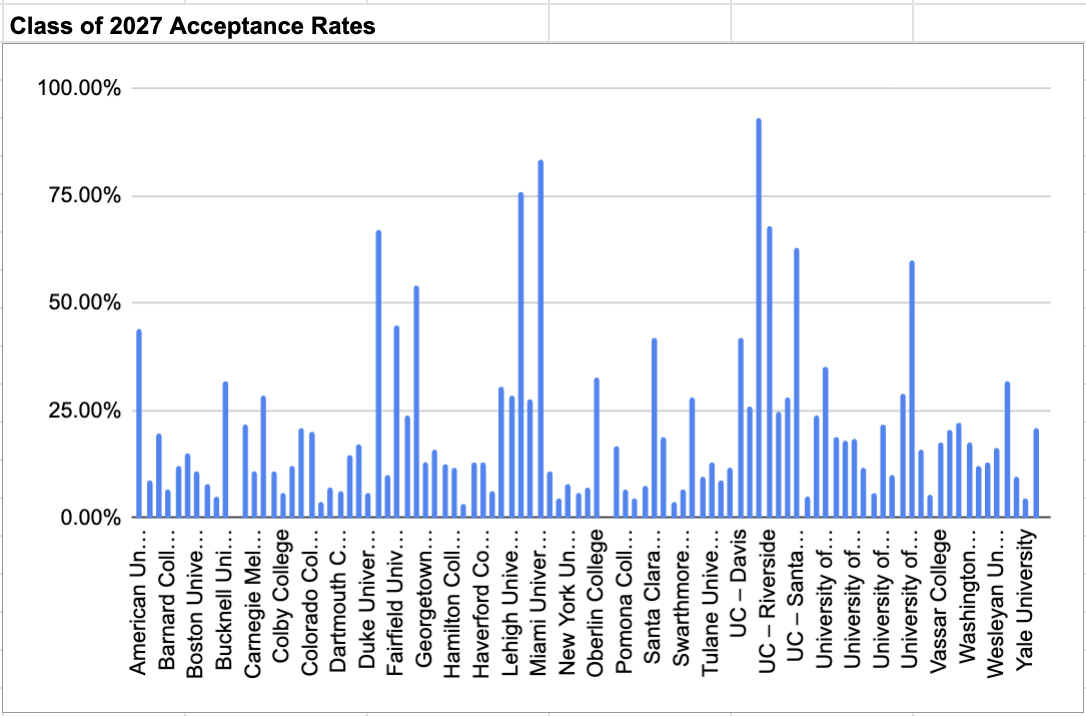
Chart 3: Individual school acceptance rates for the Class of 2027
Comparing the Class of 2027 chart to the Class of 2025 chart above, you can see most schools became modestly more selective over those two years. Taken together, these two charts support the argument that the middle tier of American higher education is quietly becoming much harder to get into.
Glossary
- Acceptance Rate
- The percentage of applicants who are admitted to a particular college or university. It is calculated by dividing the number of accepted students by the total number of applicants and multiplying by 100. A lower acceptance rate generally indicates a more competitive admissions process.
- Acceptance Year
- Demonstrated on the table as "Class of XXXX", the acceptance year refers to the year in which a student is expected to graduate from college. For example, the "Class of 2028" refers to students who are expected to graduate in the year 2028, typically meaning they were accepted into college in the fall of 2024.
- School
- What the name of the university or college is commonly referred to as. For example, "MIT" is the common name for the Massachusetts Institute of Technology.
- Acceptance Rate Trend
- The pattern of change in a school's acceptance rate over a period of time. An increasing trend indicates the school is becoming less competitive, while a decreasing trend indicates growing competitiveness.
- N/A or TBA
- The orignal data source collected acceptance rate information directly from the universities and verifiable sources. Any cell that says N/A or TBA indicates misleading information, and therefore no clear percentage could be provided.