College Application Data
Purpose:
This deck is designed to present US college admissions data of the last 5 years, covering the classes of 2025 to 2029. The purpose of this page is to give prospective college applicants an overview of how competitive admissions to various schools have been in recent years. By analyzing these trends, applicants can make more informed college application lists, decisions, and goals.
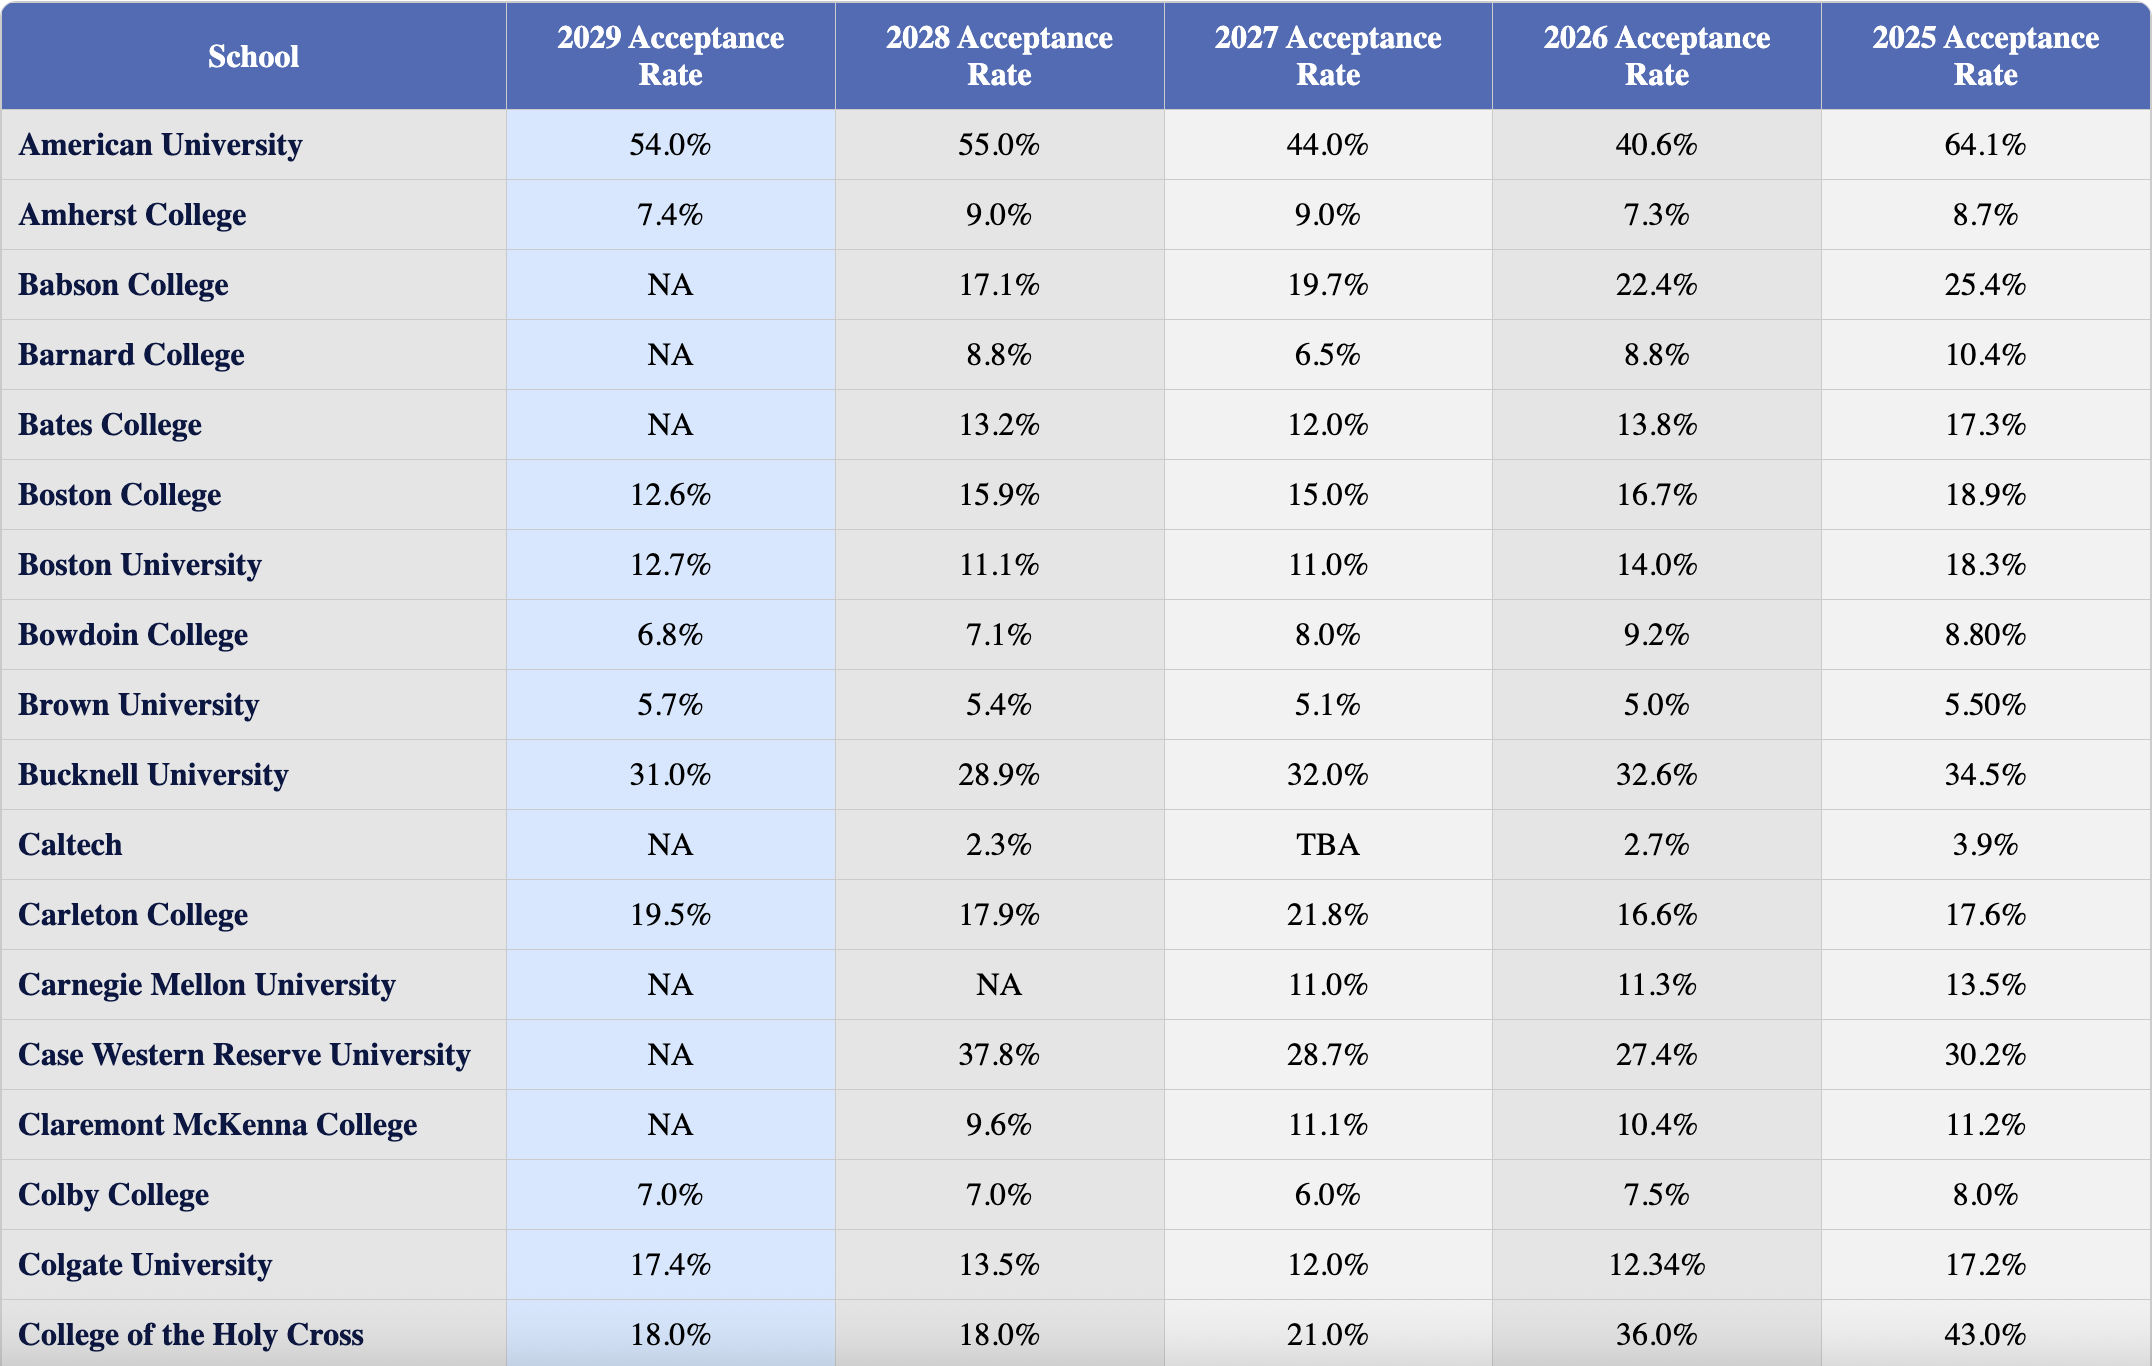
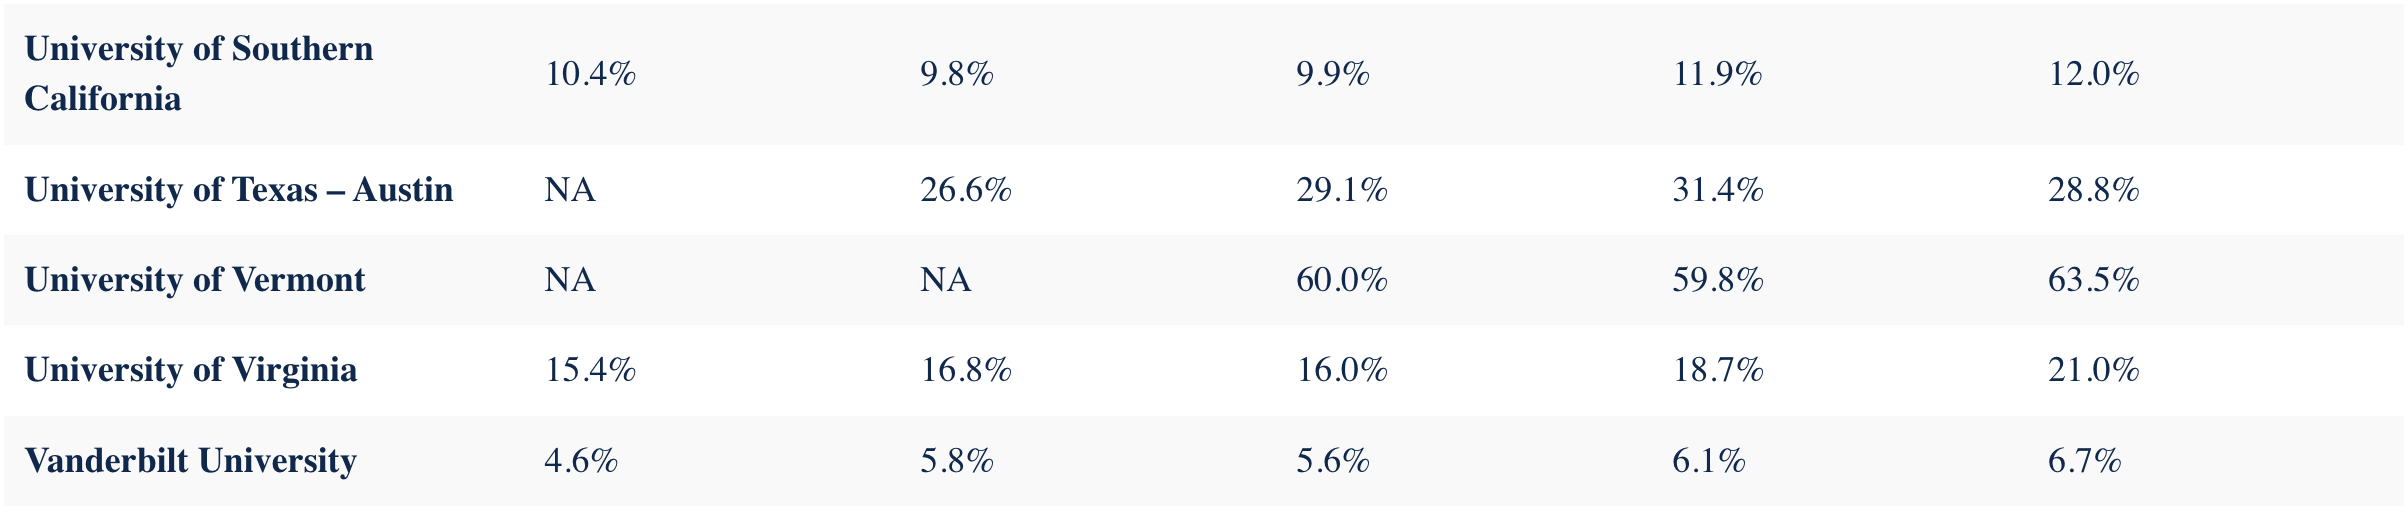
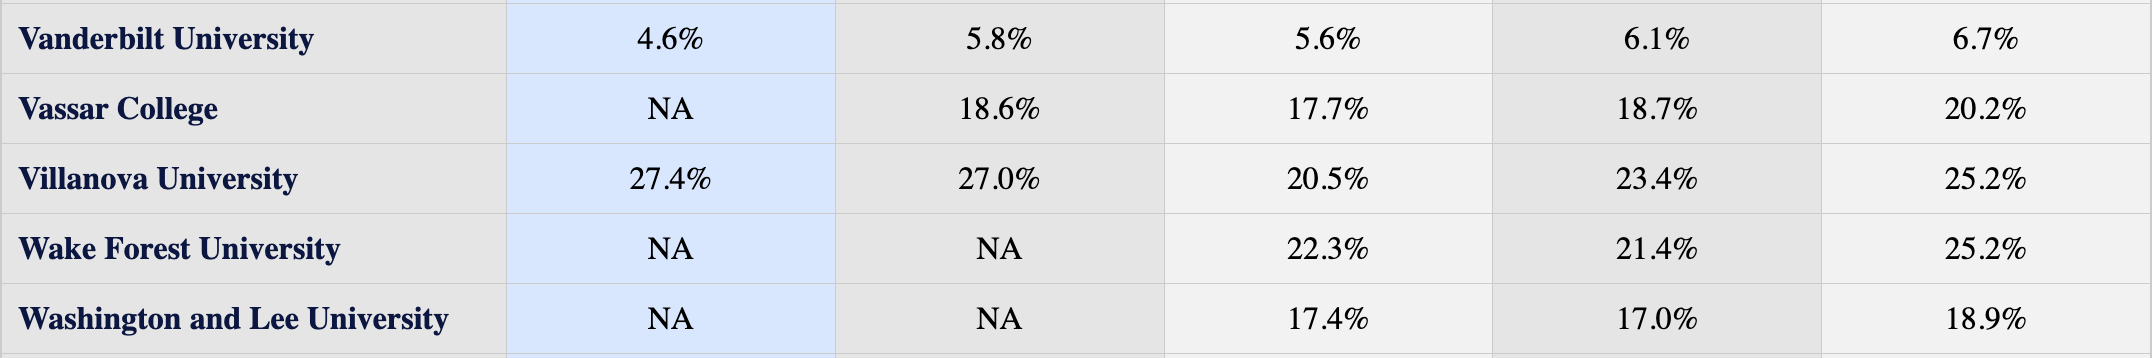
Data Table:
Acceptance Rate by School Dataset. This table shows the acceptance rates of major universities sorted by year from 2025 to 2029.
Example 1: USC's Improving Odds
USC's acceptance rate has been steadily growing over the last 5 years. Notice how the rate climbed from 9.9% in 2027 all the way to 10.4% in 2029. While it marginally dipped between 2027 and 2028, the overall trend has been an increase. This would indicate to prospective applicants that USC is becoming slightly less competitive over time, and could be a strategic pick for applicants on the fence about including it on their list.
Example 2: Vanderbilt's Consistent Selectivity
Vanderbilt is one of the most consistently selective schools in the dataset. Its acceptance rate has hovered between 4.6% and 6.7% across all five years, never crossing 7%. Unlike schools whose rates fluctuate widely year to year, Vanderbilt's stability signals a highly controlled admissions process. Applicants should treat it as a reach school regardless of the year they apply.
Conclusion:
Hopefully after taking the time to look at some of these statistics, it gives you some more insight into the college application world and landscape. Whether you are a high school student thinking about colleges, a current college student seeking to transfer, or a parent that is doing some light research, I hope this was helpful!